

Uniflow vs. Spreadsheets: Which Is Better for Startup Finance?
Uniflow vs. spreadsheets is a choice between a connected financial operating system and a manually maintained workbook. Excel and Google Sheets are excellent for flexible analysis, templates, and one-off calculations. However, recurring startup finance also requires current data, consistent metric definitions, scenario planning, reconciliations, and repeatable reporting.
Uniflow is designed to centralize those workflows so solo founders and CFOs can spend less time importing transactions, repairing formulas, and rebuilding reports. The right choice depends on transaction volume, data sources, reporting cadence, team size, and the cost of delayed decisions.
Bottom line: Use spreadsheets for flexible, one-off analysis. Use a financial operating system for recurring cash-flow tracking, forecasting, scenario planning, and management reporting.
What Is a Financial Operating System?
What is the difference between Uniflow and a spreadsheet?
Uniflow is designed for recurring financial operations, while Excel and Google Sheets are general-purpose spreadsheet tools. A spreadsheet gives an experienced user exceptional control over formulas, layouts, and custom analysis. Uniflow focuses on connected data, repeatable workflows, centralized assumptions, and decision-ready views for startup finance.
| Dimension | Uniflow | Excel or Google Sheets |
|---|---|---|
| Primary role | Recurring financial operations, forecasting, and reporting | Flexible calculations, analysis, and templates |
| Data maintenance | Designed for connected and automated workflows | Usually depends on manual imports, uploads, or user-maintained connections |
| Cash visibility | Centralized operating views and calculations | Depends on current inputs and correctly maintained formulas |
| Scenario planning | Structured scenario workflows | Often requires duplicated tabs or files |
| Reporting | Standardized dashboards and exports | Manually prepared charts and reports |
| Collaboration | Shared workspace and centralized information | Shared files with possible version and permission issues |
| Customization | Configuration within the supported data model | Very high formula and layout flexibility |
| Best fit | Startups with repeatable, connected finance processes | Simple businesses and one-off analysis |
A spreadsheet is not inherently unreliable. Risk depends on model complexity, data quality, ownership, review procedures, and how frequently inputs change. Problems arise when a workbook gradually becomes the company’s system of record without the controls, traceability, and workflow ownership expected from a finance system.
Why do spreadsheets become risky as a startup grows?
Spreadsheets become riskier as more people edit them, more systems feed them, and more decisions depend on them. Manual imports, copied tabs, hidden formulas, inconsistent definitions, and unclear ownership make it difficult to determine whether a number is current and correct. Operational risk can grow faster than the workbook itself.
Ray Panko’s review of spreadsheet-error research found that a substantial share of operational spreadsheets contain errors, particularly models with many formulas. His research also distinguishes between detecting an error and proving that it materially affects a decision. That distinction matters: spreadsheet use is not automatically defective, but critical models require controls and review. Panko’s spreadsheet research
The TransAlta spreadsheet incident illustrates the potential financial impact of a small modeling mistake. A copy-and-paste error contributed to a reported $24 million loss. The lesson is not that startups should never use Excel. It is that important financial processes need version control, documented assumptions, independent review, and a dependable audit trail.
The National Institute of Standards and Technology similarly identifies governance, documentation, accountability, and ongoing validation as important components of trustworthy systems. Those principles apply to financial automation as well as other data-driven workflows. NIST AI Risk Management Framework
How much time do startup spreadsheets consume?
A small workbook may take only minutes to update, but recurring finance work includes importing transactions, categorizing expenses, checking formulas, reconciling cash, updating assumptions, preparing charts, and answering investor or executive questions. For a growing startup, the combined workload can reasonably reach 15–23 hours per month, depending on complexity and reporting cadence.
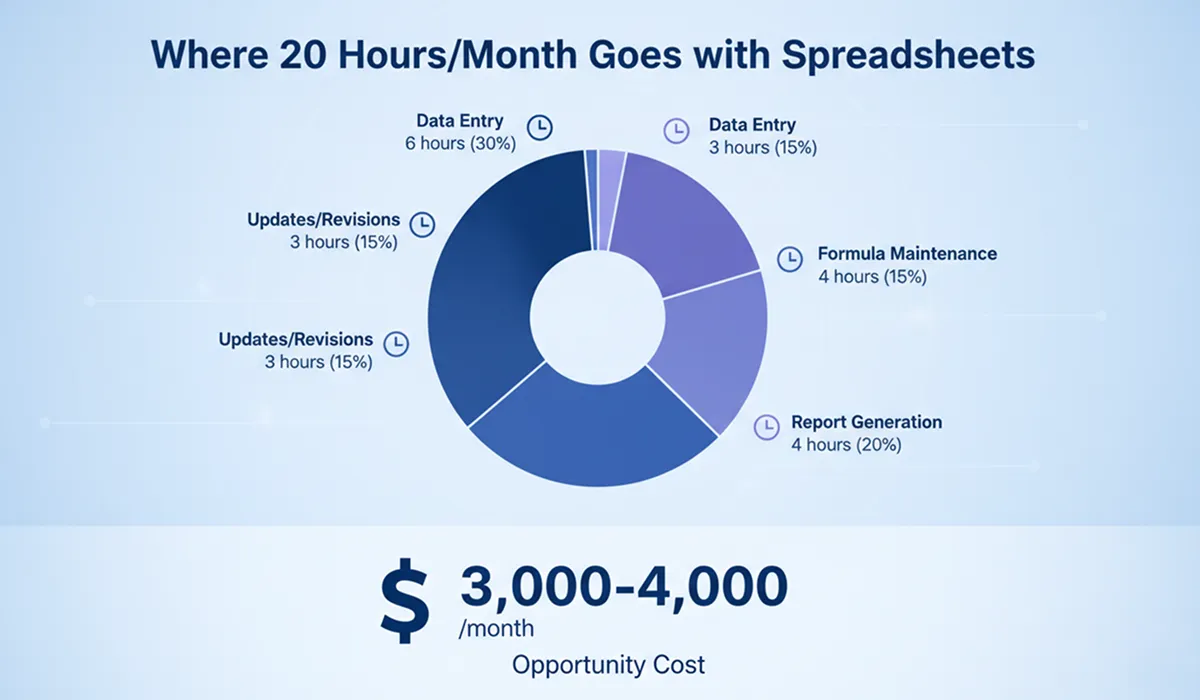
A practical monthly estimate is:
| Activity | Typical monthly time |
|---|---|
| Data entry and imports | 4–6 hours |
| Formula and assumption maintenance | 2–3 hours |
| Reconciliation and error checking | 2–4 hours |
| Management and investor reporting | 3–4 hours |
| Revisions and scenario analysis | 4–6 hours |
| Total | 15–23 hours |
At a $200 hourly opportunity cost, 15 hours of founder time represents $3,000 per month. That is not an invoice from Excel; it is the value of work the founder cannot spend on product, sales, hiring, or fundraising. CFOs should model this as an operating trade-off rather than assume that every hour can be eliminated.
What are the hidden costs of spreadsheet-based finance?
The largest hidden cost is often decision latency rather than the spreadsheet license. If a founder waits several days for a reliable runway view, a hiring decision may be delayed, a cash shortfall may be discovered late, or an investor update may require another manual review cycle.
Common hidden costs include:
- Reconciliation time: Bank, accounting, payroll, billing, and payment data must be combined manually or through fragile imports.
- Key-person dependency: One person may understand the workbook’s assumptions, exceptions, and undocumented adjustments.
- Version risk: Files named “final,” “final v2,” and “final approved” create uncertainty about which workbook governs.
- Slow scenarios: Hiring, fundraising, pricing, or expense changes may require duplicated tabs and formula checks.
- Reporting friction: Board and investor reports often require copying data into slides or separate templates.
- Control gaps: A workbook may not provide the permissions, change history, or workflow ownership required by a growing finance function.
How does Uniflow compare with Excel and Google Sheets?
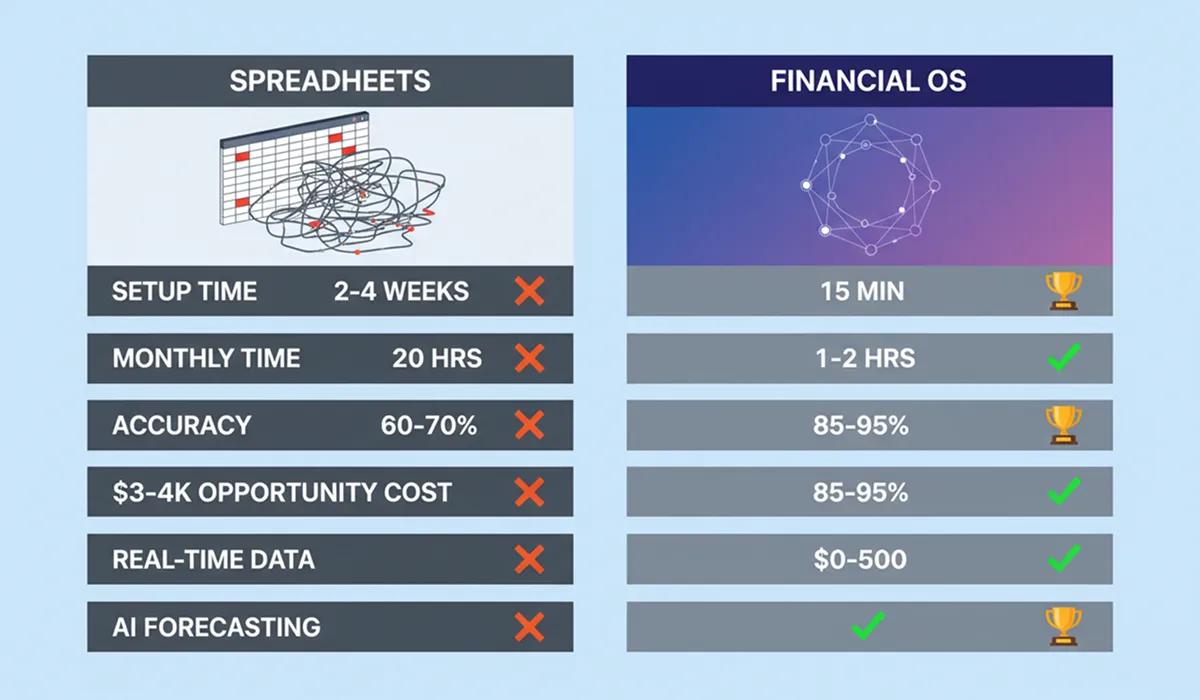
Uniflow is generally stronger for connected, recurring finance operations, while Excel and Google Sheets are generally stronger for unrestricted custom analysis. This is a comparison of operating models, not a guarantee of accuracy, savings, or forecast results. Outcomes depend on data quality, integrations, configuration, implementation, and human review.
Which tool is easier to set up?
Uniflow is typically faster to configure for a standard startup finance workflow because it uses guided setup, connected data, and pre-built operating views. A spreadsheet can be opened immediately, but creating a reliable model requires building categories, formulas, controls, and reporting views. The meaningful comparison is time to a trustworthy recurring process—not time to an empty workbook.
| Setup factor | Uniflow | Excel or Google Sheets |
|---|---|---|
| Initial workspace | Guided startup setup | Blank file or downloaded template |
| Historical data | Imported into a central model | Manually imported and mapped |
| Categories and assumptions | Configured within the platform | Built and maintained by the user |
| Training | Product walkthrough and process training | Spreadsheet- and model-specific training |
| Time to first output | Often minutes for a basic setup | Immediate for simple calculations; longer for a complete model |
Which tool is better for daily finance operations?
Uniflow is better suited to recurring daily operations when the necessary integrations and workflows are available. It can reduce repeated data entry and keep operating views aligned with current inputs. Spreadsheets remain effective when transaction volume is low, the business is simple, and one accountable owner can update and review the model consistently.
| Daily task | Uniflow | Excel or Google Sheets |
|---|---|---|
| Transaction visibility | Connected or automated data workflows | Manual entry, exports, or refreshes |
| Expense categorization | Centralized workflow | User-maintained categories |
| Formula maintenance | Platform-managed calculations | User-owned formulas and references |
| Management reporting | Dashboards and standardized views | Manual charts and report preparation |
| Scenario updates | Structured scenario inputs | Manual edits or copied model versions |
| Mobile review | Depends on current platform access | Varies by application and file design |
Which tool is better for forecasting and runway management?
A financial operating system can make forecasts easier to update because it combines current data with assumptions and scenarios. It does not make forecasting automatically accurate. Forecast quality still depends on complete transaction data, sensible assumptions, correct categorization, and management judgment. Spreadsheets offer more formula-level control, but every dependency must be maintained by the model owner.
The basic runway formula is:
Runway = Available cash ÷ monthly net burn
That formula is useful but incomplete. A decision-ready runway model should also consider:
- Expected collections and payment timing
- Payroll and hiring plans
- Contractual commitments
- Recurring and one-time expenses
- Revenue growth and churn assumptions
- Fundraising timing and probability
- Best-case, base-case, and downside scenarios
Uniflow’s potential value is the workflow around those calculations: centralizing data, updating views, and helping a founder compare scenarios without rebuilding a workbook. CFOs should still review assumptions, investigate unusual movements, and compare forecasts with actual results.
Which tool is better for reporting and investor updates?
Uniflow is usually more efficient for repeatable management and investor reporting because dashboards can use the same underlying data and metric definitions. Spreadsheets can produce excellent investor materials, especially when a CFO needs a highly customized model. The practical difference is how much manual preparation is required each reporting cycle and how confidently each figure can be traced to its source.
A consistent reporting process should define:
- Cash balance and net burn
- Gross margin and operating expenses
- Revenue, bookings, or annual recurring revenue where relevant
- Runway under stated assumptions
- Headcount and hiring plans
- Actual-versus-budget performance
- Material risks, changes, and required decisions
Neither tool replaces financial judgment. A polished dashboard with weak metric definitions is still a weak report.
Which tool provides better collaboration and control?
Uniflow is better suited to shared finance operations when several people need the same current view, permissions, and workflow context. Cloud spreadsheets support collaboration, but effective governance must be designed and maintained by the team. For either tool, access control, review ownership, metric definitions, and documented processes matter more than the interface alone.
| Control area | Uniflow | Excel or Google Sheets |
|---|---|---|
| Shared source of truth | Centralized workspace | Requires one governed file or linked files |
| Permissions | Platform-level roles and access settings | File- and folder-level permissions |
| Change history | Centralized history where supported | Version history varies by application |
| Comments and review | Contextual workflow discussions | Cell comments or separate communication |
| Metric definitions | Shared configuration | Often documented separately from the model |
| Handover risk | Lower when processes are documented in the workspace | Higher when logic exists mainly in one person’s file |
What does a real startup transition look like?
A startup may reduce finance administration after moving from a manually maintained workbook to an automated workflow, but case-study results are examples rather than guarantees. Outcomes depend on the starting process, data quality, integrations, implementation effort, and whether the team changes its operating habits after adopting the new system.
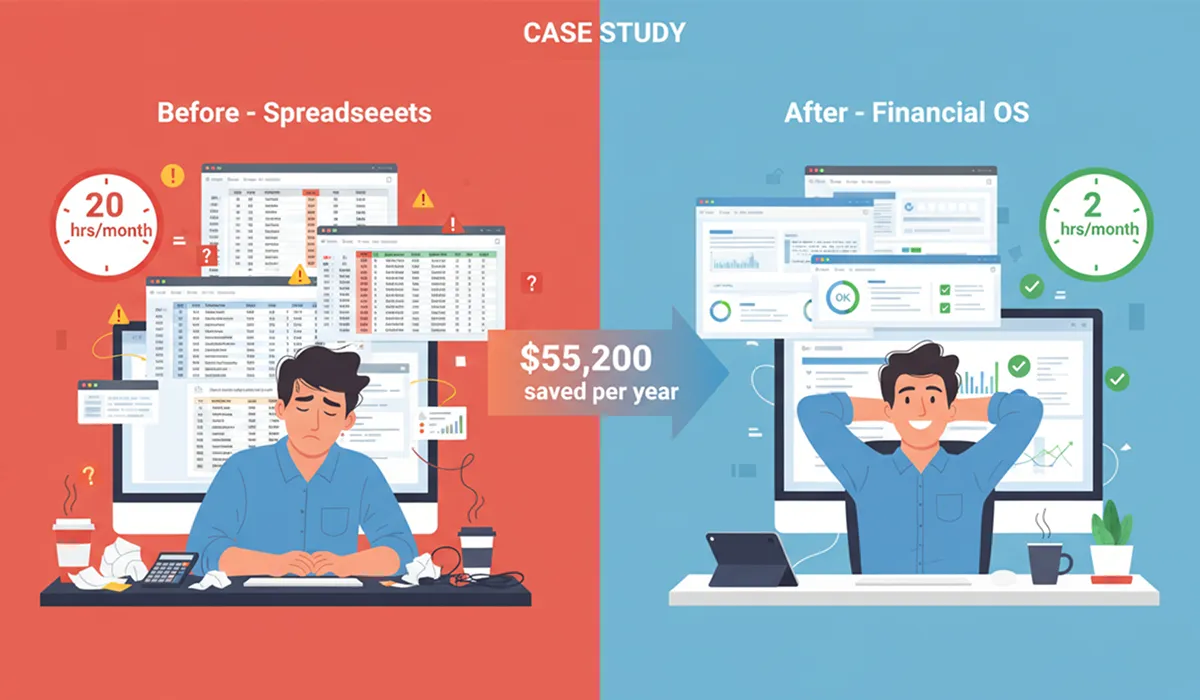
Consider this illustrative operating profile:
- SaaS company
- $1 million seed round
- Eight employees
- Founder responsible for finance oversight
- Part-time CFO advisor
- Six-month comparison period
What changed before and after adopting Uniflow?
In this illustrative profile, the founder initially spent approximately 15 hours per month on financial tracking and a CFO advisor spent approximately 10 hours reviewing and correcting the model. After recurring tracking and reporting moved into Uniflow, founder review time fell to two hours and CFO advisory time fell to two hours per month.
| Measure | Spreadsheet-led process | Uniflow-led process |
|---|---|---|
| Founder finance time | 15 hours/month | 2 hours/month |
| CFO advisor time | 10 hours/month | 2 hours/month |
| Founder time value at $200/hour | $3,000/month | $400/month |
| CFO advisor at $250/hour | $2,500/month | $500/month |
| Total modeled time cost | $5,500/month | $900/month |
This example produces a modeled annual difference of $55,200, based on assumed hourly rates and time allocations. It is not a guaranteed product saving. A CFO evaluating a similar change should substitute actual rates, workload, implementation costs, and software costs.
The modeled operational improvements were:
- Earlier visibility into a potential runway issue
- Faster hiring scenario analysis
- Fewer formula corrections
- Faster investor-report preparation
- More time for strategic review instead of data assembly
What is the total cost of ownership?
Total cost of ownership includes software, founder and finance-team time, implementation, review, and the cost of errors or delayed decisions. A spreadsheet may have a low licensing cost while consuming substantial labor. A financial platform may have a subscription cost while reducing recurring administration. Compare both operating models over at least 12 months.
How should a founder calculate spreadsheet costs?
A founder should calculate spreadsheet cost by multiplying recurring finance hours by the realistic hourly value of the person doing the work, then adding software, training, advisory, and error-remediation costs. The calculation should separate necessary financial review from avoidable data assembly. Not every hour removed from a workbook is an hour that should disappear.
Use this model:
Annual spreadsheet cost =
(finance hours per month × hourly cost × 12)
+ software and template costs
+ advisory or bookkeeping costs
+ estimated remediation cost
For example, 15 hours per month at a $200 opportunity cost equals $36,000 per year before advisory support or remediation. That is a planning assumption, not a universal benchmark.
How should a founder calculate Uniflow costs?
A founder should combine the applicable Uniflow subscription, implementation time, remaining advisory work, and integration or bookkeeping costs. Pricing and plan availability can change, so confirm current terms on the Uniflow financial operating system page before purchasing.
Use the same framework:
Annual Uniflow cost =
subscription cost
+ implementation and migration time
+ finance review time
+ advisory, bookkeeping, or integration costs
The original comparison used a free plan during its example period and modeled a $300-per-month Pro plan in a later year. Those figures are historical assumptions, not current pricing. Confirm the current plan, limits, and billing terms directly with Uniflow. The fair comparison is not “free versus paid”; it is the total cost of each operating model for your company.
When are spreadsheets still the right choice?
Spreadsheets remain appropriate when the business is simple, transaction volume is low, and one accountable person can review every important input and output. They are also valuable for custom analyses outside a platform’s standard workflow. Moving to dedicated software too early can create unnecessary process and subscription overhead.
A spreadsheet may be sufficient when:
- The company is pre-revenue or has limited transaction history.
- There are no employees, or payroll and contractor activity is minimal.
- The business has one product, few expenses, and a simple revenue model.
- One person owns the model and reviews all changes.
- There is no immediate need for connected bank, billing, payroll, or accounting data.
- Forecasting is occasional rather than a weekly management process.
- The founder can document assumptions and maintain a backup.
A spreadsheet becomes harder to justify when:
- Cash, revenue, and expenses come from several systems.
- Multiple people edit or rely on the same model.
- Hiring, fundraising, or pricing decisions require frequent scenarios.
- Investor reports require recurring manual preparation.
- The founder cannot explain how a key number was calculated.
- The company needs a close process, audit trail, or defined approval workflow.
Is a hybrid approach practical?
A hybrid approach is practical and often preferable during migration. Use Uniflow for recurring operational data, cash visibility, forecasting, and reporting. Retain Excel or Google Sheets for one-off calculations, specialized analyses, and exports required by investors or advisors. The essential control is to define which system is authoritative for each metric.
A sensible hybrid policy is:
- Choose one source of truth for cash, transactions, and core KPIs.
- Document spreadsheet inputs when an analysis uses exported data.
- Date every export and record the reporting period.
- Avoid editing core numbers in multiple systems.
- Archive superseded workbooks instead of continuing to circulate them.
- Reconcile differences before using spreadsheet analysis in a board or investor report.
How should you move from spreadsheets to Uniflow?
The safest migration is a controlled parallel run rather than an abrupt switch. Export historical data, map categories, connect available sources, validate balances, and compare key outputs with the existing workbook. Once results reconcile, designate Uniflow as the operating source of truth and retain the old workbook as an archived reference.
What should you do before importing data?
Before importing data, clean the spreadsheet and document its logic. Remove duplicate transactions, label one-time items, identify manual adjustments, and record assumptions behind revenue, hiring, and expense projections. This preparation prevents a platform migration from reproducing old categorization and data-quality problems.
Create a migration inventory containing:
- Historical transactions and reporting periods
- Bank, accounting, payroll, billing, and payment sources
- Revenue and expense categories
- Opening cash balance
- Outstanding receivables and payables
- Headcount and compensation assumptions
- Existing forecast scenarios
- Custom metrics and investor-report requirements
How should you validate the new model?
Validate the new model by comparing total cash, monthly revenue, major expense categories, net burn, and runway against the spreadsheet for the same period. Investigate every material difference rather than assuming the new number is correct. End the parallel run only when the founder or CFO can explain the differences and approve the definitions.
A practical validation checklist includes:
- Beginning and ending cash reconcile.
- Revenue totals match the accounting or billing source.
- Payroll and recurring expenses are categorized consistently.
- One-time expenses are not forecast as recurring.
- Runway uses the agreed cash and burn definitions.
- Scenario assumptions are visible and documented.
- Investor-report metrics use the same period and definitions.
- Permissions and review responsibilities are assigned.
How long does migration take?
Basic setup can take minutes when data sources and categories are straightforward. A complete migration commonly takes one to two weeks of intermittent work. Calendar time depends less on account creation than on historical cleanup, integration access, metric definitions, and validation. Complex models may require a longer parallel period and CFO review.
What should CFOs evaluate before choosing a financial operating system?
CFOs should evaluate data connectivity, calculation transparency, permissions, auditability, forecasting controls, exports, implementation effort, and total cost. A platform is useful only if the finance team can explain its numbers and leadership can act on them. Product breadth should not substitute for process quality or accounting discipline.
Ask vendors:
- Which bank, accounting, payroll, billing, and payment integrations are supported?
- How frequently does each source refresh?
- How are duplicate, missing, or uncategorized transactions handled?
- Can users trace a dashboard figure to source data?
- How are assumptions, overrides, and scenario changes recorded?
- What roles and permissions are available?
- Can reports and raw data be exported?
- What happens if an integration fails?
- What support is available during migration?
- How are pricing, usage limits, security, and data retention documented?
Also distinguish between forecast automation and forecast certainty. An automated forecast can update quickly, but it cannot know about an unrecorded contract, an unexpected churn event, or a hiring decision that leadership has not entered. Human review remains part of a sound finance process.
What is the final verdict on Uniflow vs. spreadsheets?
Uniflow is the stronger choice for startups that need a repeatable, connected finance process and want to reduce manual work around cash flow, forecasting, scenarios, and reporting. Spreadsheets remain the better choice for simple businesses, one-off analysis, and highly customized calculations. The decision should be based on control, data freshness, recurring effort, and decision speed.
| Decision factor | Better fit |
|---|---|
| Simple business with few transactions | Spreadsheet |
| Recurring cash and runway monitoring | Uniflow |
| Highly customized one-off model | Spreadsheet |
| Multiple data sources | Uniflow |
| Frequent hiring or fundraising scenarios | Uniflow |
| Individual analysis with no shared workflow | Spreadsheet |
| Shared management and investor reporting | Uniflow |
| Need for maximum formula-level flexibility | Spreadsheet |
| Need to reduce repetitive finance administration | Uniflow |
For a solo founder, the trigger to move is usually not spreadsheet failure. It is the point at which maintaining the workbook takes time away from product, sales, hiring, or fundraising. For a CFO, the trigger is usually control: the company needs consistent definitions, reliable refreshes, traceable assumptions, and a process that does not depend on one workbook owner.
If that describes your company, review Uniflow’s financial operating system and test it against your current workflow. Start with a parallel run, validate the numbers, and keep spreadsheets for analyses where they remain the best fit.
What are the most common questions about replacing spreadsheets?
Is Excel still useful after adopting Uniflow?
Yes. Excel and Google Sheets remain useful for ad hoc analysis, custom calculations, investor requests, and data exports. The goal is not to eliminate every spreadsheet. The goal is to stop using a manually maintained workbook as the primary system for recurring financial operations when a connected workflow is more reliable.
Will migration preserve historical financial data?
Historical data can generally be imported when it is available in a supported format, but preservation depends on data quality, mapping, and current import capabilities. Export and back up the original workbook before migration. Then reconcile opening balances, categories, and reporting periods rather than assuming a successful upload means a complete migration.
Can Uniflow replace a company’s accounting system?
A financial operating system and an accounting system serve related but different purposes. Accounting software typically supports the formal ledger, compliance, and financial statements. Uniflow can support operational visibility, forecasting, cash management, and decision workflows. Confirm system boundaries and integrations before treating either product as a replacement for the other.
Can Uniflow handle custom startup metrics?
Uniflow can support custom metrics where its current configuration and data model allow them. Define each metric’s formula, source, owner, and reporting period before implementation. If a metric depends on unusual operational data, confirm that the required source and calculation are supported rather than assuming every spreadsheet formula has a direct equivalent.
How accurate are automated forecasts?
Automated forecasts can be more consistent and easier to refresh than manually maintained forecasts, but no tool guarantees a specific accuracy percentage. Results depend on historical data, transaction categorization, seasonality, pipeline assumptions, and unexpected business changes. Review forecast-versus-actual performance regularly and adjust assumptions when the business changes.
What if a startup needs both Uniflow and spreadsheets?
Using both tools is reasonable when their roles are explicit. Use Uniflow as the source of truth for agreed operational metrics and recurring reporting, then export data for specialized analysis in Excel or Google Sheets. Avoid maintaining competing versions of cash, revenue, burn, or runway across multiple files.
How should a founder decide whether to switch now?
Switch when recurring finance work consumes meaningful founder or finance-team time, when data comes from multiple sources, or when decisions require frequent scenarios and current cash visibility. Stay with a spreadsheet when the business is simple and one accountable person can maintain and review it without delaying important operating decisions.
Related reading:
- Financial Operating System 101: Complete Guide
- How AI Improves Financial Forecasting
- Why Founders Fail at Financial Planning
- Financial OS vs. Traditional FP&A
- Panko’s Spreadsheet Research
Keywords: replace Excel spreadsheets with AI, Uniflow vs spreadsheets, financial operating system vs. Excel, AI-powered financial OS, startup financial tools, Excel alternative for startups, Google Sheets alternative, financial forecasting software