

Financial Operating Systems for Startups: How to Connect Unit Economics, Cash Flow, and Runway
A financial operating system for startups connects financial data, workflows, planning, and reporting in one continuously updated view. It helps a solo founder or CFO understand not only whether growth is profitable, but also when cash will arrive, how much hiring the business can afford, and how long current capital will last.
What does a financial operating system do for a startup?
A financial operating system turns disconnected transactions, accounting records, payroll data, customer metrics, and forecasts into an operating cadence. Accounting records what happened; a Financial OS helps the team understand what is happening now, model what may happen next, and decide how to respond.
A practical Financial OS should connect:
- Bank and card feeds
- The accounting ledger
- Accounts payable and receivable
- Payroll and headcount plans
- Customer, revenue, and retention data
- Budgets and forecasts
- Scenario models
- Board and investor reporting
This is different from simply adding another dashboard. The goal is to create a reliable path from actuals to metrics to decisions.
For example, a planned hire should not be evaluated only against an annual salary. The decision should also account for payroll taxes, start date, expected ramp time, incremental software costs, projected revenue, cash runway, and the effect on the company’s burn multiple.
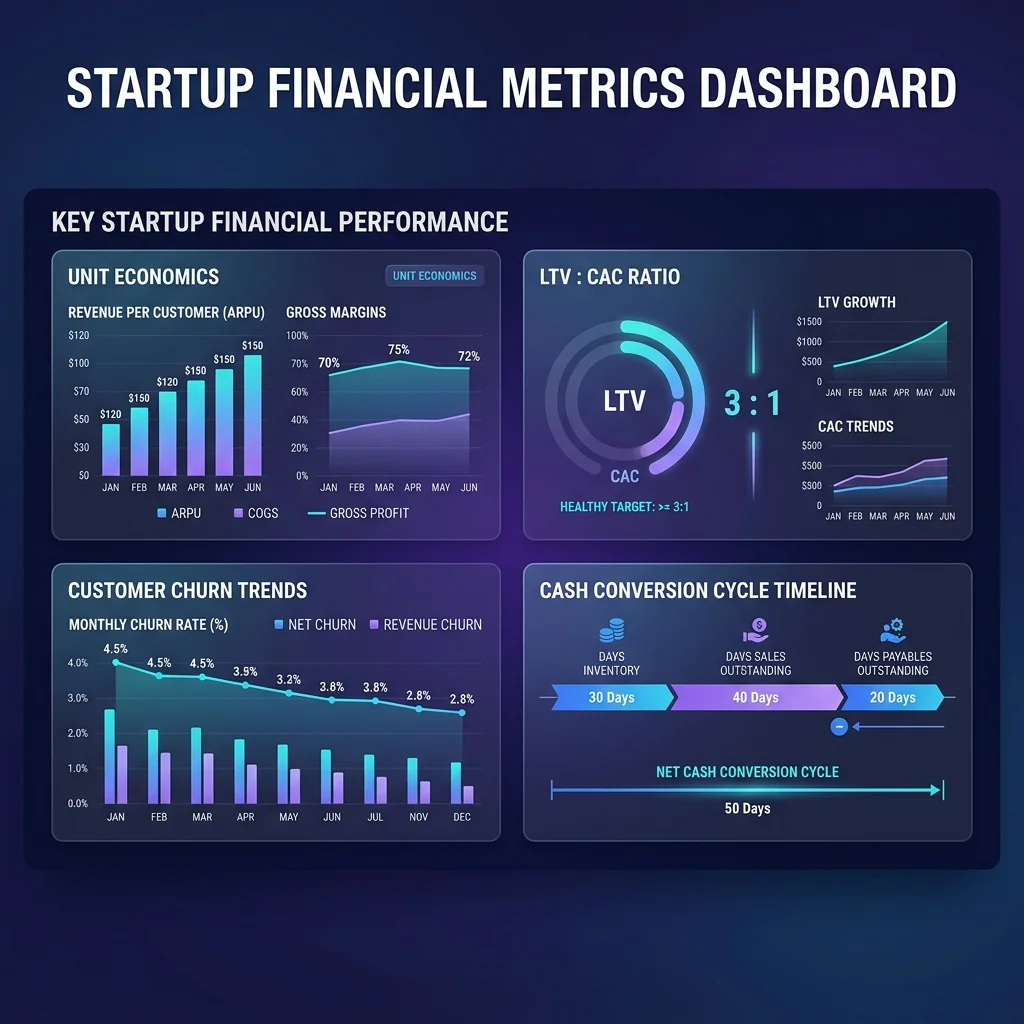
Why is LTV:CAC alone not enough to measure capital efficiency?
LTV:CAC measures the economic value generated by a customer relative to the cost of acquiring that customer, but it does not show how quickly the company recovers its cash. A startup can report a healthy 3:1 ratio and still face a liquidity problem if acquisition costs take two years to repay.
The five metrics should be read together:
- Gross margin — how much revenue remains after the direct cost of delivering the product or service.
- CAC payback — how long it takes to recover customer acquisition costs through gross profit.
- Retention or net revenue retention — whether existing customers remain and expand.
- Burn multiple — how much net cash the company burns to create new recurring revenue.
- Runway — how many months the company can operate at its current net burn.
A 3:1 LTV:CAC ratio is a directional benchmark, not a universal rule. It can be misleading when churn is immature, gross margin is overstated, acquisition costs exclude founder or sales labor, or lifetime value is calculated from a small customer cohort.
How are the core startup finance metrics calculated?
The core formulas are straightforward, but each depends on consistent definitions and a suitable measurement period. Founders should document which costs and customers are included before comparing results month to month. A precise formula with incomplete data is less useful than a simple formula applied consistently.
| Metric | Formula | What it tells you | Common limitation |
|---|---|---|---|
| CAC | Sales and marketing costs ÷ new customers acquired | Cost to acquire one customer | Results change significantly depending on whether salaries, commissions, and onboarding are included |
| Gross-margin-adjusted LTV | Average revenue per account × gross margin ÷ customer churn rate | Estimated gross profit from a customer relationship | Simplified for recurring revenue and unreliable when churn is unstable |
| CAC payback | CAC ÷ monthly gross profit per customer | Months required to recover acquisition cost | Does not capture payment delays or implementation costs unless they are included |
| Burn multiple | Net burn ÷ net new ARR | Cash burned to generate new recurring revenue | Sensitive to timing and unsuitable for businesses without recurring revenue |
| Runway | Cash balance ÷ average monthly net burn | Approximate months before cash is exhausted | Averages can hide upcoming hires, annual bills, or seasonal revenue |
| Net revenue retention | Beginning recurring revenue from a cohort plus expansion minus contraction and churn, divided by beginning revenue | Whether existing revenue base is growing | Does not measure new-customer acquisition efficiency |
For a more complete cash view, founders should also track the cash conversion cycle:
Cash Conversion Cycle = Days Inventory Outstanding + Days Sales Outstanding − Days Payables Outstanding
For many software startups, inventory is negligible, so the practical focus is often how quickly invoices are collected compared with when vendors and employees must be paid.
How does a worked example change the interpretation of unit economics?
A worked example shows why payback and cash timing matter. Suppose a software company spends $12,000 to acquire a customer, generates $4,000 in annual revenue, and has a 75% gross margin. Monthly gross profit is $250, so CAC payback is 48 months.
If the customer’s modeled lifetime is five years, gross-margin-adjusted LTV is:
- $4,000 annual revenue × 75% gross margin × 5 years = $15,000
- LTV:CAC = $15,000 ÷ $12,000 = 1.25:1
The company has not reached a healthy 3:1 ratio, and the long payback period creates substantial cash pressure.
Now assume pricing rises to $6,000 annually and delivery costs fall so gross margin reaches 85%:
- Annual gross profit = $6,000 × 85% = $5,100
- Monthly gross profit = $425
- CAC payback = $12,000 ÷ $425 = approximately 28 months
- Five-year LTV = $6,000 × 85% × 5 = $25,500
- LTV:CAC = $25,500 ÷ $12,000 = 2.1:1
The economics improve materially, but the company may still need enough cash to finance nearly 28 months of acquisition payback. This is why a founder should not approve additional sales spending from LTV:CAC alone.
Decision rule: If LTV:CAC looks strong but CAC payback is too slow for the company’s runway, improve pricing, payment terms, onboarding cost, sales efficiency, or customer mix before accelerating acquisition.
Which five numbers should founders review regularly?
Founders should review gross margin, CAC payback, retention, burn multiple, and runway on a defined schedule. Weekly reviews should focus on cash and major variances; monthly reviews should recalculate unit economics; quarterly reviews should revisit assumptions, pricing, hiring capacity, and growth investment.
| Metric | Suggested review frequency | Useful question |
|---|---|---|
| Cash balance and runway | Weekly | Did actual cash movement change the date when we need more capital? |
| Gross margin | Monthly | Is revenue growing faster than the direct cost to serve customers? |
| CAC payback | Monthly or by cohort | Are newly acquired customers repaying acquisition spend quickly enough? |
| Churn or net revenue retention | Monthly or quarterly | Is the existing customer base strengthening or deteriorating? |
| Burn multiple | Monthly or quarterly | Are we converting incremental cash into recurring revenue efficiently? |
| Forecast versus actuals | Monthly | Which assumptions were wrong, and should the forecast change? |
Benchmarks should be treated as directional. A self-serve software company, enterprise software company, marketplace, and consumer subscription business have different sales cycles, margins, and cash requirements.
How should a founder diagnose weak unit economics?
The right response depends on which part of the economic system is weak. A single ratio cannot identify the problem. Founders should separate acquisition efficiency, customer value, gross margin, and cash timing before deciding whether to cut spending or invest more.
| Observed pattern | Likely problem | First action |
|---|---|---|
| High CAC and high retention | Acquisition is expensive, but the product may have durable value | Improve channel mix, sales conversion, pricing, and referral efficiency |
| Low CAC and poor retention | Customers are inexpensive to acquire but do not receive lasting value | Investigate onboarding, activation, product fit, and customer success |
| Strong LTV:CAC and slow payback | The modeled economics may be attractive, but cash is tied up too long | Review billing terms, annual prepayment, implementation cost, and sales cycle |
| Fast payback and weak gross margin | Cash returns quickly, but delivery may not scale profitably | Revisit pricing, infrastructure, support, and service costs |
| Good revenue growth and worsening burn multiple | Growth requires disproportionate cash investment | Reduce inefficient spend or improve conversion and expansion |
| Stable revenue and shrinking runway | Costs are rising faster than gross profit | Reforecast hiring, discretionary spend, and payment timing |
This diagnostic approach is more useful than applying a fixed “good” or “bad” threshold to every startup.
How does financial data become an operating system?
A Financial OS works when data moves from source systems into a consistent model, where it can be reconciled, categorized, forecast, and reported without repeated manual copying. The architecture should preserve a clear distinction between actual transactions, management assumptions, and scenario outputs.
A useful data flow has seven layers:
- Source data: bank accounts, cards, payroll, invoices, bills, accounting, CRM, and billing systems.
- Reconciliation: matching transactions to invoices, vendors, customers, and ledger accounts.
- Classification: assigning consistent categories, departments, projects, and cost centers.
- Metric layer: calculating revenue, gross margin, CAC, churn, payback, burn, and runway.
- Planning layer: modeling hiring, pricing, sales capacity, vendor costs, and capital needs.
- Scenario layer: testing base, downside, and investment cases.
- Reporting layer: producing management, board, and investor reporting from the same definitions.
Spreadsheets can remain useful for analysis, but they should not be the only place where critical financial data exists. The risk is not that spreadsheets are inherently bad; it is that uncontrolled versions, manual imports, and undocumented formulas make it difficult to identify which number is correct.
What is the real cost of disconnected finance workflows?
Disconnected workflows create three problems: delayed information, duplicate work, and inconsistent definitions. A founder may have one cash balance in the bank, another in a spreadsheet, and a third in a board report because each view was updated at a different time.
Common failure points include:
- Copying bank transactions into spreadsheets
- Re-entering invoice data into multiple systems
- Rebuilding a hiring plan after every forecast change
- Calculating runway without upcoming bills or payroll changes
- Reporting revenue metrics without matching customer cohorts to the ledger
- Using an annual budget that cannot be compared with current actuals
Research frequently cited around spreadsheet errors should be interpreted carefully. A widely referenced study by Raymond Panko found errors in a substantial share of audited spreadsheet models, but that does not mean every spreadsheet contains an error. The practical lesson is narrower and more useful: important financial models need review controls, version discipline, and reconciliation.
Automation can reduce repetitive entry, but it does not eliminate the need for accounting judgment or review. A poorly categorized transaction can remain wrong even when it was imported automatically.
How can a Financial OS improve cash planning and hiring decisions?
A connected finance model allows a founder to evaluate hiring and spending as cash-flow decisions rather than isolated department requests. The model should show the timing of each expense, the assumptions behind the investment, and the conditions under which the decision should be revisited.
For a proposed hire, model:
- Salary, taxes, benefits, and recruiting costs
- Start date and expected ramp time
- Equipment and software costs
- Expected contribution to revenue or capacity
- Effect on gross burn and net burn
- Downside case if revenue growth is delayed
- New runway under each scenario
Uniflow’s headcount planning tools help connect salary budgets and hiring assumptions to the broader financial plan. For organizations planning beyond immediate vacancies, workforce planning software can help model organizational design, future hiring needs, and the financial effect of team growth.
The decision rule is simple: approve an investment when the expected operational benefit is clear, the downside case is survivable, and the assumptions are visible enough to review later.
How does a Financial OS support fundraising readiness?
Fundraising readiness depends less on producing a sophisticated model than on producing numbers that are consistent, reconciled, and explainable. Investors and lenders need to understand the company’s historical performance, current cash position, assumptions, and likely capital requirements.
A useful fundraising package should include:
- Reconciled monthly financial statements
- A written definition for each key metric
- Revenue and retention by cohort where relevant
- Gross margin by product or customer segment
- CAC and payback methodology
- Historical forecast-versus-actual analysis
- Current cash balance and runway
- Hiring plan and compensation assumptions
- Base, downside, and investment scenarios
- A clear explanation of unusual transactions or changes
The quality of the data matters because diligence often exposes inconsistencies between the pitch deck, accounting system, bank balance, and operating model. There is no universal diligence timeline or universal Series A revenue threshold; expectations vary by sector, geography, business model, and market conditions. Founders should avoid treating any single benchmark as a promise of fundraising success.
A Financial OS makes the process repeatable by allowing the same underlying data to support monthly management reporting, board materials, and investor analysis.
How does Uniflow fit into a startup finance operating model?
Uniflow is an AI-powered financial operating system for startups that brings cash visibility, forecasting, budgeting, scenario planning, headcount planning, and reporting into a connected workflow. It is designed for solo founders, finance leaders, and growing teams that need more control than disconnected spreadsheets provide without building a large finance function.
Uniflow can support the operating loop in four ways:
- Visibility: Bring current financial information into a clearer view of cash position, spending, and runway.
- Planning: Connect budgets, forecasts, and hiring assumptions so changes can be evaluated together.
- Scenarios: Compare base, downside, and growth cases before committing capital.
- Reporting: Create a consistent foundation for management and investor reporting.
For founders focused on short-term liquidity, cash-flow forecasting and runway tracking help answer when cash will be available and how long it may last. For recurring planning work, budgeting and forecasting can connect actual performance to future assumptions. Teams managing invoices and approvals can also evaluate accounts payable automation as part of reducing manual finance work.
Uniflow does not replace sound metric definitions, accounting review, or financial judgment. Its value is in making those processes more connected, current, and usable for decisions.
What is a practical 30-day implementation plan?
A Financial OS implementation should begin with reliable definitions and a small number of decisions, not an attempt to model every possible variable. A four-week rollout gives a founder or CFO enough time to establish a baseline, test the workflow, and create a repeatable review cadence.
What should happen during week one?
During week one, connect the core financial sources and establish the baseline. Confirm bank and card accounts, accounting data, accounts payable, payroll, and recurring revenue sources. Reconcile the opening cash balance and document the chart of accounts, reporting periods, and ownership of each data source.
What should happen during week two?
During week two, define the metrics that will drive decisions. Document how the company calculates gross margin, CAC, churn, LTV, CAC payback, burn multiple, and runway. Calculate a baseline using recent actuals and identify which figures are estimates rather than observed results.
What should happen during week three?
During week three, build the operating forecast and hiring scenarios. Create a base case, downside case, and investment case. Add planned hires, contract renewals, annual bills, pricing changes, sales capacity, and expected collections. Record the assumption behind every material change.
What should happen during week four?
During week four, establish the review cadence and reporting package. Set a weekly cash review, monthly forecast-versus-actual review, and quarterly strategy review. Produce a concise management report showing cash, runway, gross margin, retention, payback, burn multiple, and the decisions that require attention.
What should founders remember about financial operating systems?
A financial operating system is valuable because it connects decisions that are often managed separately. Unit economics explain whether customers can create value. Cash-flow forecasting explains when that value becomes usable cash. Headcount planning explains how the team changes the cost base. Scenario planning shows what happens when assumptions are wrong.
The most important operating loop is:
- Acquire a customer.
- Measure revenue and gross margin.
- Track CAC payback.
- Monitor retention and expansion.
- Compare cash collected with cash spent.
- Reinvest only when the resulting cash profile supports it.
This loop is more durable than any single benchmark. A startup becomes more capital-efficient when it can explain its numbers, update them regularly, and connect them to specific operating actions.
Frequently asked questions about financial operating systems for startups
What is a financial operating system?
A financial operating system is a connected layer for financial data, workflows, planning, forecasting, and reporting. It combines information from accounting, banking, payroll, expenses, revenue systems, and operational plans so a startup can make decisions from current and consistent financial information.
Is a Financial OS the same as accounting software?
No. Accounting software primarily records and organizes financial transactions. A Financial OS uses accounting data alongside cash, revenue, payroll, hiring, forecasting, and scenario information to support forward-looking operating decisions. Accounting remains an important source of truth within the broader system.
What is a good LTV:CAC ratio for a startup?
A 3:1 LTV:CAC ratio is often used as a directional SaaS benchmark, but it is not universal. The appropriate target depends on gross margin, customer concentration, sales cycle, churn, growth stage, and payback period. A ratio should always be reviewed alongside cash velocity and retention.
Is CAC payback more important than LTV:CAC?
Neither metric is sufficient by itself. LTV:CAC estimates long-term customer economics, while CAC payback shows how quickly acquisition spending returns as gross profit. For a cash-constrained startup, payback may be the more immediate constraint because a theoretically profitable customer can still consume too much cash before repayment.
How often should startup runway be updated?
Runway should be reviewed weekly when cash is tight, spending is changing quickly, or a financing event is approaching. A formal forecast should usually be updated monthly, with changes to hiring, revenue, collections, and major expenses reflected as soon as they become probable.
When should a startup move beyond spreadsheets?
A startup should consider moving beyond spreadsheet-only finance when multiple people edit the model, actuals require repeated manual imports, forecasts are difficult to reconcile, hiring decisions materially affect runway, or management and investor reports use different numbers. The trigger is operational complexity, not a specific revenue milestone.
Can a solo founder use a Financial OS without a CFO?
Yes. A solo founder can use a Financial OS to establish consistent cash visibility, metric definitions, forecasting, and reporting before hiring a finance leader. The system does not replace an accountant or CFO, but it can reduce administrative work and make professional financial review more productive.
What is the first financial workflow to automate?
Start with the workflow that consumes the most recurring time or creates the greatest decision risk. For many startups, that means connecting bank data, reconciling transactions, tracking bills and collections, or maintaining a cash forecast. Automate data movement first, then improve categorization, planning, and reporting.